An October set helped pay for a record quarter that ended in September. That’s the detail in the Hasbro Q3 2026 results I’d keep beside the headline, especially if you’re trying to connect the health of Magic to the number at the bottom of your collection.
Hasbro’s October 20 earnings release puts Magic revenue at $616.1 million, up 34% from $459.4 million a year earlier. It’s the game’s first quarter above $600 million. Management credits The Hobbit and Reality Fracture, which means an August release and an October release both helped produce that September result.
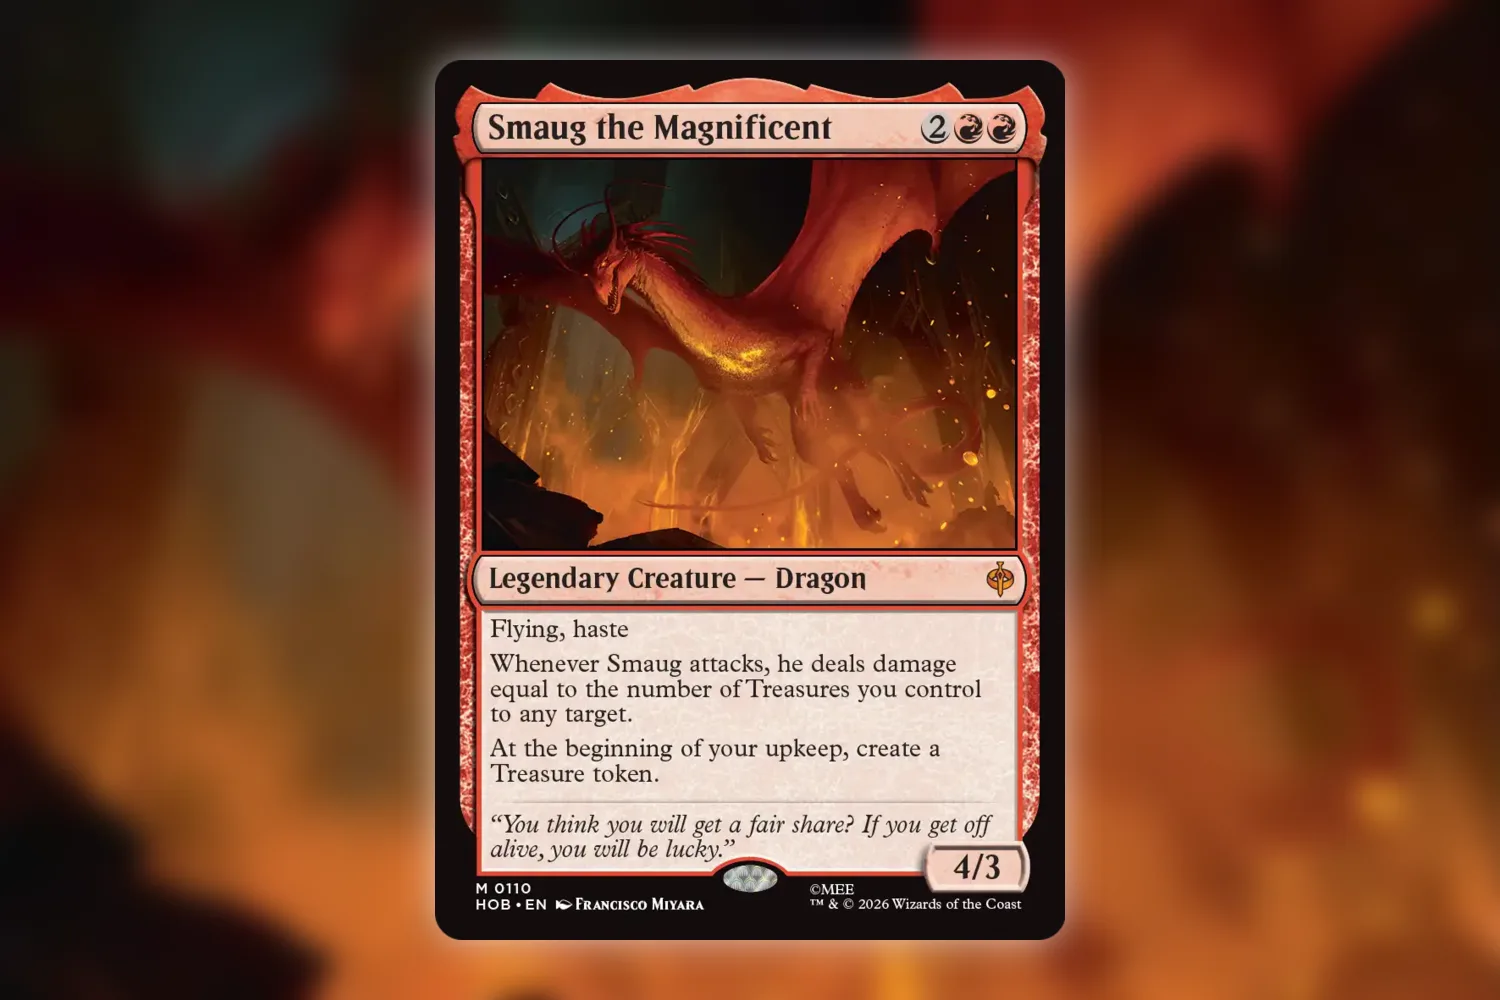
Then there’s Smaug the Magnificent, the very recognizable Dragon from one of those successful sets. The ordinary nonfoil copy is $21.55 when I check on October 22. The relationship between those two numbers takes a little more work than a triumphant earnings headline leaves room for.
Reading the Hasbro Q3 2026 numbers without mixing the buckets
These are the figures I’d keep from the release. All dollar amounts in this table are millions, and the comparisons are against the same quarter of 2025.
| Reported business | Q3 2026 revenue | Year-over-year change |
|---|---|---|
| Hasbro overall | $1,595.3 | +15% |
| Wizards of the Coast and Digital Gaming | $747.2 | +31% |
| Tabletop Gaming within Wizards | $613.1 | +39% |
| Digital and Licensed Gaming within Wizards | $134.1 | +3% |
| Magic: The Gathering brand | $616.1 | +34% |
The two rows within Wizards add up to the segment total. The Magic brand row cuts across that split: Magic includes digital business, while Tabletop Gaming also includes Dungeons & Dragons. Adding $616.1 million to $613.1 million would count overlapping business twice. And calling the tabletop row “paper Magic sales” would quietly give Magic credit for the other tabletop products in there.
I find this annoyingly easy to do because the numbers are so close. Six hundred and thirteen, six hundred and sixteen. Close the tab, tell someone at Commander night that paper Magic made six hundred million, and suddenly you’ve improved the precision of the report by remembering it badly.
Wizards also reported $367.4 million in operating profit and a 49.2% operating margin. That belongs to the whole Wizards and Digital Gaming segment. Hasbro says it includes a $7 million benefit from tariff refunds. There’s enough going on inside that percentage that I wouldn’t use it to estimate the margin on the booster box behind a shop counter.
My Q2 article spent a lot of time on supply disruption. This quarter gives us a much clearer, quantified example of a different timing problem.
Forty million dollars crossed the quarter boundary
In Hasbro’s prepared management remarks, the CFO says approximately $40 million of Magic sales expected in the fourth quarter were recognized in the third, primarily related to Reality Fracture. Later in the same remarks, she describes the early revenue as Reality Fracture and backlist pre-shipments.
Reality Fracture’s tabletop release was October 2. Stores needed product ahead of that date, including for September prerelease events. Product can move through the distribution chain and enter Hasbro’s reported sales before the wider release weekend when players open it. An October release contributing to Q3 therefore has a fairly ordinary explanation involving boxes getting where they need to go.
About 6.5% of Magic’s reported quarter came from that $40 million timing shift. You can subtract it and get roughly $576 million, but I’d keep that calculation scribbled in the margin. Hasbro reported $616.1 million. The subtraction is an illustration of timing, and it doesn’t reconstruct how every other order would have behaved under a different shipping schedule.
The same $40 million comes out of management’s previous fourth-quarter expectations. If the next report has a less exciting growth rate, part of the explanation was already on the page in October. Hasbro still raised its full-year company revenue outlook to 7–9% growth in constant currency, from 5–7%. That guidance covers the whole company and uses a currency-adjusted comparison, so I’d resist turning it into an exact prediction for Magic’s next quarter.
For someone sorting a collection, the frustrating gap is the point where a box gets opened. A manufacturer’s sales figure can tell you product entered the channel. To understand supply of a particular single, you’d also want to know which products people opened, which treatments those products contained, and how many copies reached sellers. This report gives us very little of that card-level detail.
I don’t know how many unopened Hobbit boxes are sitting in closets. I doubt anyone outside a few very large sellers has a useful view of even their own corner of that pile.
Smaug and Jace have moved in different directions
The site already has dated price records for cards from both sets. Those let us put a smaller, messier dataset beside the corporate one without inventing a historical price chart.
For the same regular nonfoil printings, here’s what the earlier articles recorded and what Scryfall returns on October 22:
| Card and printing | Earlier recorded price | October 22 price |
|---|---|---|
| Smaug the Magnificent, HOB 110 | $27.24 on August 16 | $21.55 |
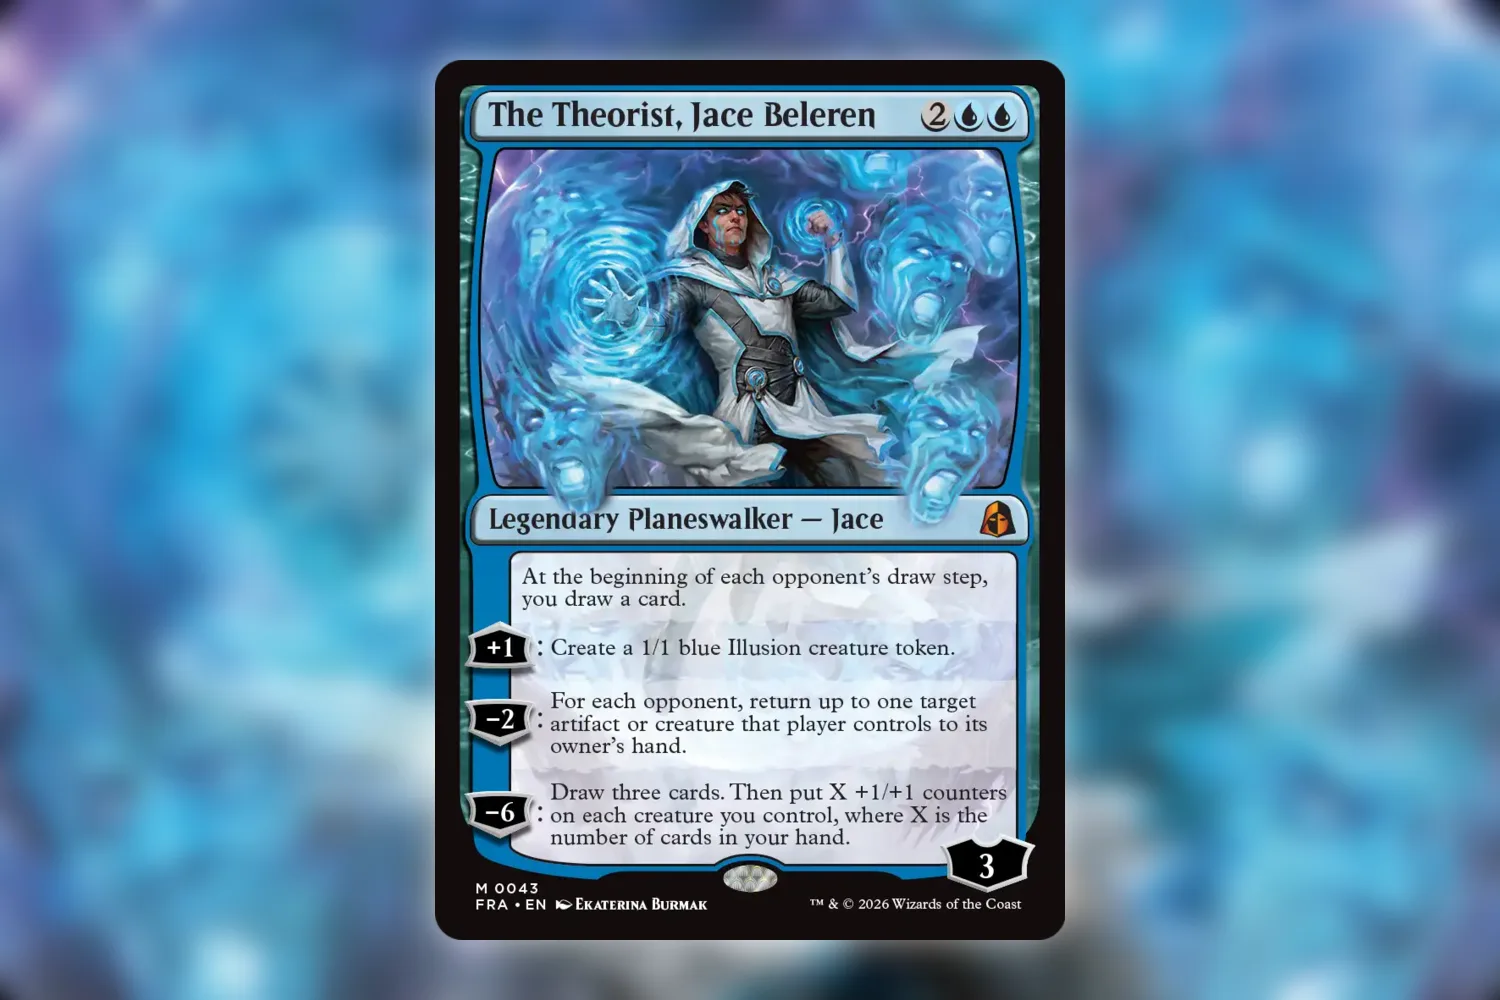
| The Theorist, Jace Beleren, FRA 43 | $29.32 on September 26 | $57.44 |
Smaug’s earlier figure comes from the Hobbit price follow-up, which preserves the August release-week record. The Theorist, Jace Beleren appears in the September Reality Fracture price audit. These are observations from articles published here, followed by today’s lookup. They aren’t the highest or lowest prices either card reached between those dates.
Smaug is down about 21% from that August figure. Jace is up about 96% from the late-September one. Both come from sets management names as drivers of the record quarter. Two cards are a tiny sample, but they’re already enough to make “the game is selling well, therefore my new cards should rise” a poor way to price a binder.
I once spent an evening looking for a Smaug I’d put in a Hobbit box behind the wrong divider. I’d alphabetized the dividers and then put them back facing the rear of the box, which gave me a beautifully organized collection I had to read upside down. I found him while looking for something else and left the dividers that way for another week. The Dragon was fine.
I am tempted to give the earnings news more weight than this, though. A growing audience ought to create more people looking for cards, and management says The Hobbit had the largest Universes Beyond prerelease participation it had seen. Star City Games’ report on the call also relays the company’s confidence in backlist sales. That sounds encouraging for older cards somebody might discover through a new set.
I’d like the missing piece: how much additional demand lands on each printing while additional supply arrives. Jace’s two observations don’t establish his future direction, and Smaug’s decline doesn’t establish a rule for Dragons. I’m comfortable leaving both questions open until there’s more evidence.
The collection total needs a comparable pile
There’s a very boring way to accidentally give yourself a record quarter too. Add a new Commander deck, import an old binder, update prices, then look at the larger collection total and feel pleased about how well your cards performed.
Some of that change came from adding cards. Some came from changing their prices. If a previous entry had the wrong foil setting or printing, some might be a correction. A total mixes all of those together unless you keep enough detail to separate them later.
For an October check in Eldwyn, I’d start with a bounded group I can compare again: the Hobbit cards logged in August, for example. Check the recognized printing and finish, save the current quantities and prices, and keep any new purchases identifiable. A saved export or a dated spreadsheet beside the inventory is useful if you want to compare an unchanged group later.
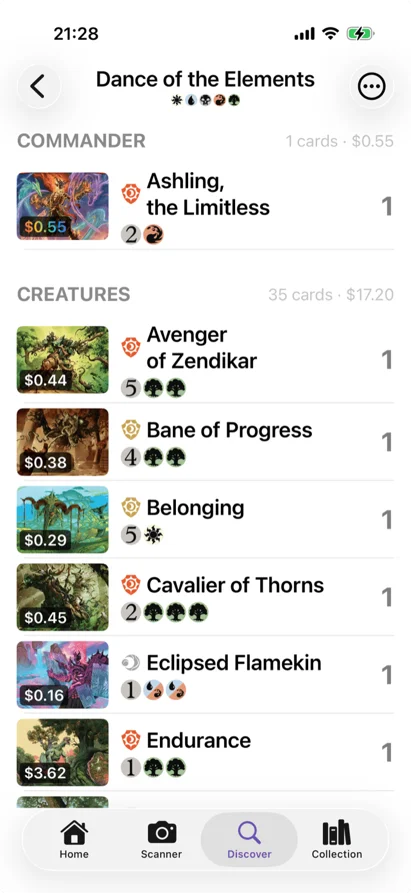
I’d also write down the price source. Scryfall’s USD field uses TCGplayer market pricing; a shop’s cash offer can be lower. The distinction between market, low, and other price labels becomes quite noticeable when a collection moves from an app screen to an actual sell pile.
For my next check, I’d leave a note beside HOB 110 and FRA 43 with the date, quantity, finish, and the two prices above. Then I’d pick a date to look again. If I add another copy before then, it gets its own entry in the notes. I’ve already made the dividers harder to read than they need to be; the arithmetic can stay manageable.